Key points
- The performance point is the expected displacement of a building in the design earthquake, where its capacity meets the seismic demand.
- ATC-40 finds it on a spectrum chart, while FEMA 356 and FEMA 440 calculate a target displacement with correction coefficients.
- At Halim Station, FEMA 356 gave the largest displacement, ATC-40 the smallest and FEMA 440 fell in between.
A pushover curve shows what a building can do, but it does not yet say how far the building will move in the design earthquake. To find that, engineers locate the performance point by comparing the building's capacity with the seismic demand. Three methods are commonly used: ATC-40, FEMA 356 and FEMA 440.
The previous part explained how pushover analysis works.
Why the performance point matters
The pushover curve is the "capacity": how much force the building can resist at each level of displacement. The design earthquake is the "demand": the force and displacement imposed by ground shaking at that site. The performance point is where capacity meets demand. The three methods below are different ways of finding it.
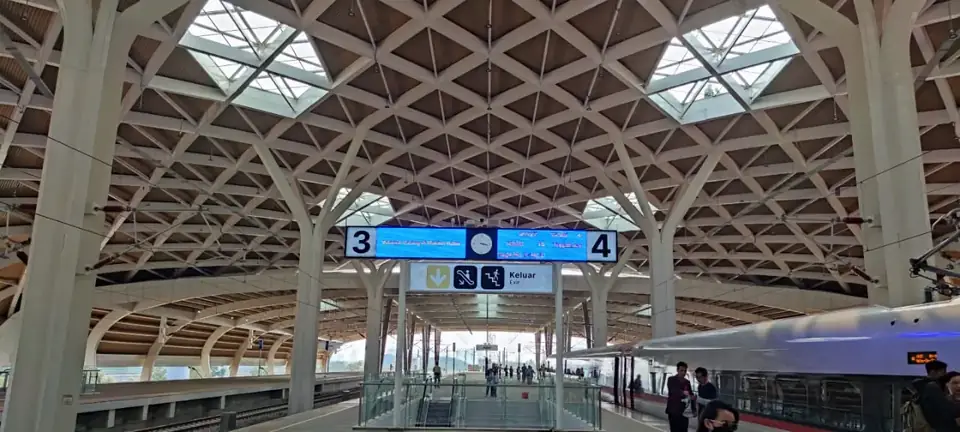
In the SAP2000 model of Halim High-Speed Railway Station, seismic input was entered for all three methods: for ATC-40 as the coefficients Ca = 0.4 × Fa × Ss = 0.363 and Cv = Fv × S1 = 0.853; for FEMA 356 and FEMA 440 as Ss = 0.714, S1 = 0.308, site class E and 5% damping.
Method 1: ATC-40 capacity spectrum method
ATC-40 (1996) plots capacity and demand on the same chart in ADRS format (acceleration-displacement response spectra): spectral acceleration (Sa) against spectral displacement (Sd).
- The capacity curve becomes a capacity spectrum. Base shear is divided by the building weight and the first-mode modal mass coefficient; roof displacement is divided by the modal participation factor and the first-mode amplitude at roof level.
- The response spectrum is converted to ADRS format using Sd = T² / (4π²) × Sa × g.
- The demand spectrum is reduced for effective damping. Once the structure yields it absorbs energy, so the demand is lower than the 5% elastic spectrum.
The intersection of the capacity spectrum and the reduced demand spectrum is the performance point. ATC-40 offers three procedures: Procedure A (direct iteration), Procedure B (a family of demand spectra with several damping values and a bilinear capacity curve) and Procedure C (a graphical method with construction lines).
The damping that may be counted depends on the structural behaviour type:
| Shaking duration | New building (good quality) | Average existing building | Poor existing building |
|---|---|---|---|
| Short | Type A | Type B | Type C |
| Long | Type B | Type C | Type C |
Method 2: FEMA 356 coefficient method
FEMA 356 (2000) does not look for an intersection on a chart. It calculates a target displacement (δt) directly:
δt = C0 × C1 × C2 × C3 × Sa × (Te / 2π)² × g
Te is the effective fundamental period, derived from the elastic period and the ratio of elastic to effective stiffness on the pushover curve. Four coefficients convert the result of a simple oscillator into the behaviour of the real building:
- C0: the difference between roof displacement of a multi-storey building and that of a single-degree-of-freedom system.
- C1: the difference between peak nonlinear and linear displacement, mainly for short-period structures.
- C2: the effect of stiffness degradation under cyclic loading.
- C3: extra displacement from P-Δ effects.
The coefficients come from FEMA 356 tables and equations. C0 depends on the number of storeys and the load pattern: it is 1.0 for a single-storey building and increases for taller ones. C1 is 1.0 when Te is equal to or longer than the characteristic period of the spectrum Ts, and greater than 1.0 when Te is shorter than Ts.
The point on the pushover curve at that target displacement is the performance point.
Method 3: FEMA 440 improved coefficient method
FEMA 440 (2005) was prepared because ATC-40 and FEMA 356 often gave significantly different estimates of maximum displacement for the same building. It keeps the FEMA 356 approach of a target displacement but improves two coefficients:
- C1 = 1 + (R − 1) / (a × Te²). This removes the FEMA 356 limitation on C1 for relatively short-period structures. The value of a depends on the site class.
- C2 = 1 + (1/800) × ((R − 1) / Te)². This coefficient covers cyclic stiffness degradation as well as strength degradation.
Note that R in the FEMA 440 equations is the ratio of elastic strength demand to the yield strength of the structure, not the R factor of SNI 1726.
Tip: Do not rely on one method alone. When several methods give similar answers, confidence in the result grows. When they differ widely, find out why before making a decision.
Results for Halim Station
For the X direction under the SNI 1726:2012 earthquake (a return period of about 2,500 years), the three methods gave these performance points:
| Method | Base shear | Displacement |
|---|---|---|
| ATC-40 | 485,975 kN | 0.076 m |
| FEMA 356 | 551,714 kN | 0.094 m |
| FEMA 440 | 516,979 kN | 0.085 m |
The pattern was the same in every case studied: FEMA 356 gave the largest displacement and base shear, ATC-40 the smallest, and FEMA 440 fell in between. Across all cases, the displacement at the performance point stayed within roughly 0.07–0.10 m.
Conclusion
ATC-40 finds the performance point where the capacity spectrum meets the demand spectrum, while FEMA 356 and FEMA 440 calculate a target displacement with correction coefficients. Using all three, as for Halim High-Speed Railway Station, gives a more convincing range of results. The next part explains how a performance point is translated into a building performance level. For a seismic performance check of your building, contact our team through our structural audit and evaluation service.
This article provides general information. Every project still needs to be analysed and calculated by a competent structural or geotechnical engineer, in line with the applicable SNI codes and regulations.
Sources
- Annin Hudaya, Sobah Nurul Sodik, James Theofilbert Sabas: Case Study of Performance Based Design Check on Halim High Speed Railway Station Project. Seminar & Short Course HAKI 2022, Hotel Borobudur, Jakarta, 23–25 Agustus 2022
- FEMA 440: Improvement of Nonlinear Static Seismic Analysis Procedures (ATC-55, 2005)
- FEMA 440, Improvement of Nonlinear Static Seismic Analysis Procedures (Applied Technology Council)